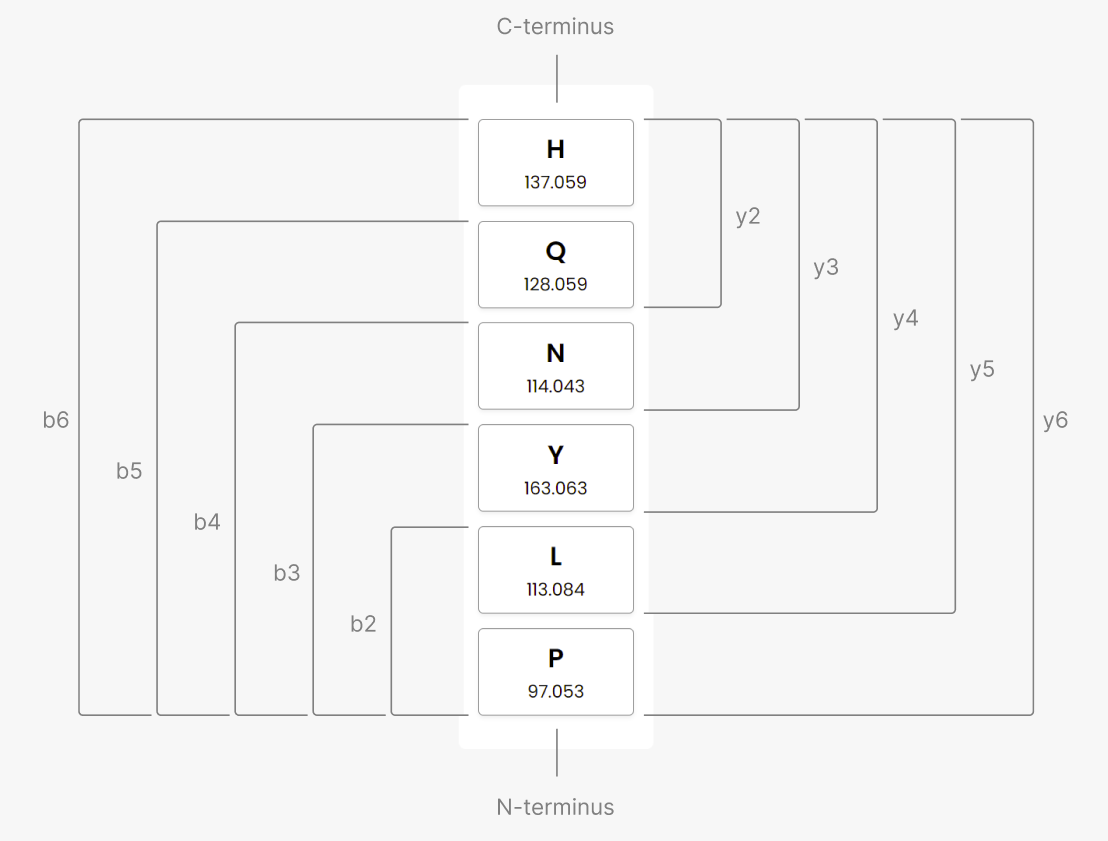
This is a teaching tool demonstrating the relationship between the order of amino acids in a peptide and the peptide’s mass spectrometry data. The list on the left represents a sequence of amino acids forming a peptide, and the graphs on the right represent simulated mass spectrometry data from that peptide. Rearranging the peptide changes the simulated masses shown in the "Current Masses" graph. Based on the masses shown in the "Goal Masses" graph, reorder the "Current" amino acids to match the peptide.
Each bar represents the summed masses of a peptide fragment. The fragments range in length from dipeptides (length 2) to the entire peptide. All fragments include the C-terminus and/or N-terminus. The masses are arranged in ascending order, which does not necessarily alternate C- and N-terminus fragments: b2, y2, b3, y3, etc.